Usage Statistics
General
When you bring multiple Shiny apps to your end users, it may be interesting to track usage of the different applications over time. It may a.o. help to understand your user base and to prioritize maintenance work for the different applications.
ShinyProxy has a general model on board that allows one to store Shiny app events and for different storage back-ends, different plug-ins are available. Currently, ShinyProxy ships with plug-ins that can store events in the following back-ends:
Alternative plug-ins can easily be developed and are on the roadmap.
Starting from ShinyProxy 2.5.0 an extra plug-in was added that supports Micrometer.io. Micrometer itself is a modular library that allows to support many popular monitoring system. Our focus is to export Prometheus Metrics, however, any Micrometer supported monitoring system is supported.
For Kubernetes, a complete monitoring stack for ShinyProxy can be found on GitHub. This provides metrics using Prometheus, log aggregation using Loki and dashboards using Grafana. Everything has been prepared to easily deploy this on your infrastructure.
InfluxDB
Installation
InfluxDB installation is very simple: on an Ubuntu 16.04 LTS system one just needs to download and install the package using something along
wget https://dl.influxdata.com/influxdb/releases/influxdb_1.0.2_amd64.deb'
sudo dpkg -i influxdb_1.0.2_amd64.deb
To start the database one can use
sudo service influxdb start
and querying its status can be done with
sudo service influxdb status
Database creation
In order to store the usage statistics, a specific database needs to be created
on the InfluxDB instance. In this example we use the name
shinyproxy_usagestats.
To do so one can use the CLI client:
influx
then, at the database prompt, enter
CREATE DATABASE shinyproxy_usagestats
quit
Configuration
Once the database is created, we can configure ShinyProxy to post all usage
events to the shinyproxy_usagestats database. It’s sufficient to add a single
property in the application.yml file under the shiny / proxy section:
proxy:

  #  ...

  usage-stats-url: http://localhost:8086/write?db=shinyproxy_usagestats
As can be seen, InfluxDB has the advantage that the storage of usage events can
be done on a separate server and shouldn’t necessarily happen on localhost
i.e. the machine on which the ShinyProxy server itself is running.
Note:
- If authentication is required, you can use the
proxy.usage-stats-usernameandproxy.usage-stats-passwordproperties. - More detailed information on configuring ShinyProxy can be found here
SQL based databases (JDBC)
Installation
Please refer to the official documentation of your database system for installation.
Configuration
It’s sufficient to only add a JDBC URL in the usage-stats-url field in
the proxy section of the application.yml file:
proxy:

  # ...

  # for MonetDB
  usage-stats-url: jdbc:monetdb://localhost:50000/usage_stats

  # for MySQL/MariaDB
  usage-stats-url: jdbc:mysql://localhost/shinyproxy

  # for SQLite
  usage-stats-url: jdbc:sqlite:shinyproxy.sql

  # for PostgreSQL
  usage-stats-url: jdbc:postgresql://localhost/postgres

  # for MS SQL Server:
  usage-stats-url: jdbc:sqlserver://localhost;databaseName=shinyproxy
Similarly to InfluxDB, the events can be stored on a separate server
and event logging shouldn’t necessarily happen on localhost i.e. the machine
on which the ShinyProxy server itself is running.
Using the proxy.usage-stats-attributes property it’s possible to record
additional attributes. For example, to record the sub of the OpenID user:
proxy:
  usage-stats-attributes:
    - name: sub
      expression: "#{oidcUser?.attributes?.sub}"
ShinyProxy automatically creates additional columns for these additional
attributes (the name field is used as name for the column). It’s important
that these expressions properly handle null values. The same expression is
used for every event, while not every event has the same variables in the
expression context. For example, for some events the context doesn’t contain the
authentication objects.
It’s also possible to override the default logged attributes using the
proxy.usage-stats-attributes property. For example, to not log the username of
users, use:
proxy:
  usage-stats-attributes:
    - name: username
      expression: "redacted"
Note:
- ShinyProxy automatically creates a table to store the events.
- The default table used is
event, this can be changed by configuring theproxy.usage-stats-table-nameproperty. - If authentication is required, you can use the
proxy.usage-stats-usernameandproxy.usage-stats-passwordproperties. - More detailed information on configuring ShinyProxy can be found here.
CSV file
In many cases deploying a full database engine, just for usage statistics, is considered too much work. When running a single replica of ShinyProxy it’s possible to use SQLite. To support multiple replicas, ShinyProxy can write the usage statistics to CSV files. To fully support writing these files to a network share (e.g. NFS or SMB), ShinyProxy doesn’t lock these CSV files. Instead, every replica must write its events to a unique CSV file. At the time of analyzing the files, these files can be manually combined into a single dataset.
With the following example configuration, ShinyProxy generates a UUID and uses this as the name for the CSV file. This guarantees that the CSV file has a unique name.
proxy:
  usage-stats-url: "#{T(java.util.UUID).randomUUID()}.csv"
Example CSV file:
"event_time","username","type","data"
"1750082373390","jack","Login",""
"1750082381063","jack","ProxyStart","shiny-demo"
"1750082511837","jack","ProxyStop","shiny-demo"
"1750082579361","jack","Logout",""
Micrometer (Prometheus)
Note
This section describes manually setting up Prometheus and Grafana. However, when using the ShinyProxy Operator a compressive monitoring stack is available. On Docker the installation is fully automated. On Kubernetes the manifests must be deployed separately.This section describes on how to set up the Micrometer monitoring backend using
Prometheus. It assumes that ShinyProxy, Prometheus and Grafana (see later) are
all running on localhost.
Configuration
Start by changing your ShinyProxy configuration so that it includes the following configuration:
proxy:

#  ...

    usage-stats-url: micrometer

management:
  prometheus:
    metrics:
      export:
        enabled: true

#  ...
The Prometheus metrics are now available at the
localhost:9090/actuator/prometheus endpoint. Note that you shouldn’t include
any context-path in this URL.
Setup Prometheus
The next step is to ensure that Prometheus scrapes your ShinyProxy server. For
demonstrating purposes, it’s enough
to download it and extract it on your server.
The next step is to adapt your configuration (by editing the
included prometheus.yml file), so that Prometheus scrapes the ShinyProxy
server:
scrape_configs:
  - job_name: 'shinyproxy'
    metrics_path: '/actuator/prometheus'
    static_configs:
      # note: this is the port of ShinyProxy Actuator service, not the port of Prometheus which is by default also 9090
      - targets: [ 'localhost:9090' ]
        labels:
          namespace: local
          shinyproxy_realm: local
Now you can start Prometheus. Make sure to run it on a different port than 9090, since that port is already being used by ShinyProxy:
./prometheus --web.listen-address="0.0.0.0:7070"
Now go to your browser and open
http://localhost:7070/targets, this page should
contain one target called shinyproxy with the UP state.
Setup Grafana
Now that Prometheus scrapes the metrics, we need a way to visualize these metrics. An excellent tool for this is Grafana. Start by downloading Grafana, again you can use the standalone binaries and simple extract them. Then start Grafana using:
./bin/grafana-server
Next, access Grafana on http://localhost:3000 and login
using admin:admin. Next add Prometheus as datasource, remember that Prometheus
is running at http://localhost:7070.
The final step is to import the dashboard. Download the JSON file (right-click and choose save as) and import it into Grafana. If everything is correctly setup, you should see the graph changing when you log in, start an app etc.
In order to provide more accurate graphs in Grafana, the scrape interval used by Prometheus should correspond to the one specified in the configuration of Grafana. The dashboard makes use of this option in order to perform certain calculations. This settings can be configured at the datasource settings in Grafana. See the Grafana docs.
It’s possible to embed Grafana into ShinyProxy, by specifying the
proxy.monitoring.grafana-url property. This option is automatically used by
the ShinyProxy Operator.
It’s not recommended to use this option without using the operator.
Note: with the release of ShinyProxy 2.6.0 and 3.0.0 the dashboard has been updated and is incompatible with previous releases.
Exposed metrics
All metrics exposed by ShinyProxy are tagged with the shinyproxy_instance tag,
containing the instance id of the ShinyProxy server.
ShinyProxy keeps track of the following actions:
- User Login (
userLogins) - User Logout (also by expiring session) (
userLogouts) - Authentication failure
authFailed - App start (
appStarts, contains aspec_idtag) - App stop (
appStops, contains aspec_idtag) - Duration of app startup (
startupTime, contains aspec_idtag) - Duration of app usage (
usageTime, contains aspec_idtag) - Time between the start of the app process and when the app is
reachable by ShinyProxy. For example, in the case of the Shiny app, this is
the time the R process takes to startup and be reachable on its webserver.
(
applicationStartupTime, contains aspec_idtag) - Time needed for the container to get assigned to a node on Kubernetes.
Includes the time to launch a new node if the cluster needs to
scale-up. (
containerScheduleTime, contains aspec_idtag) - Duration of pulling the image (only available on Docker and
Kubernetes,
imagePullTime, contains aspec_idtag) - Duration of container startup (before the process itself
starts) (
containerStartupTime, contains aspec_idtag) - App start failures (
startFailed, contains aspec_idtag) - App crashes (
appCrashes, contains aspec_idtag) - Absolute number of running apps (
absolute_apps_running, contains aspec_idtag) - Absolute number of logged-in users (
absolute_users_logged_in) - Absolute number of active users. A user is counted as active if they were
active in the last minute. (
absolute_users_active) - Metadata about apps (
delegate_app_statusandappInfo)
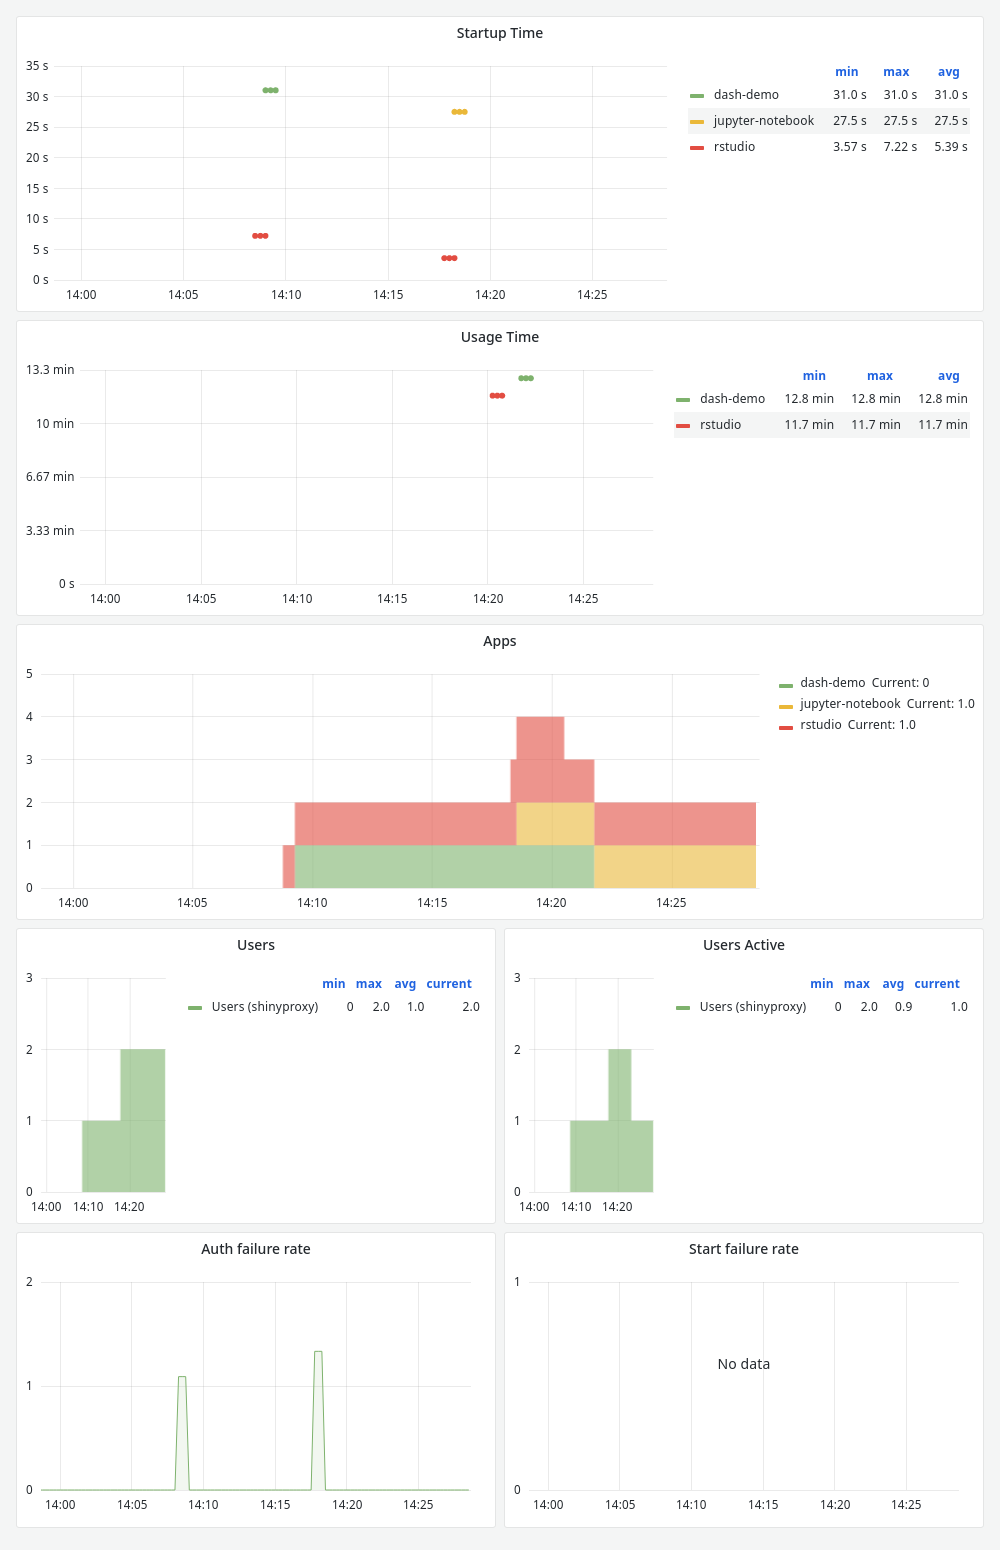
Note
Currently ShinyProxy uses CamelCase for some metric sand snake_case for other metrics names. In a future release, this will be converted into all snake_case (which is recommended by Prometheus).Screenshot
Metric name prefix
It’s a good practice to differentiate the metrics generated by ShinyProxy with
any other metric stored in Prometheus. Of course, Prometheus attaches some tags
(also known as labels) to all metrics that can be used for this purpose. Nevertheless,
it can be useful to prefix all metrics exposed by ShinyProxy. This can be done
by setting the proxy.usage-stats-micrometer-prefix option to a self-chosen
string.
For example, the following code will prefix every metric exposed by ShinyProxy
with shinyproxy_. It’s not required to end the prefix with _ or any other
separator symbol. The reason is that ShinyProxy automatically determines the
correct separator for the used metric backend.
proxy:
  usage-stats-micrometer-prefix: shinyproxy
Using multiple statistics backends
In some cases it can be useful to log statistics to multiple databases. For
example, logging infrastructure related metrics to Prometheus (i.e.
observability) and keeping an audit trail in a SQL database. This is possible (
since ShinyProxy 3.0.0) using the proxy.usage-stats property. This property
takes a list of configuration blocks. Each block should contain at least the
parameter url which is explained above. Each block can also have a username
and password property if needed for the statistics backend. For example, to
log to Micrometer (for Prometheus) and PostgreSQL:
proxy:
  usage-stats:
    - url: micrometer
    - url: jdbc:postgresql://localhost/postgres
      username: postgres
      password: mysecretpassword
      table-name: my-custom-table-name # optional
      attributes:
        - name: sub
          expression: "#{oidcUser?.attributes?.sub}"